Dutch bank lending is growing just fine
Disclaimer: This post (like all others) represents my opinion alone and should not be attributed to De Nederlandsche Bank, the Eurosystem or, indeed, anyone else.
tl;dr An article in the Financieele Dagblad claims that Dutch bank lending growth does not seem to be in line with economic growth in the Netherlands. This observation is based on a stock-flow mismatch. If one corrects this mistake, the conclusion gets reversed.
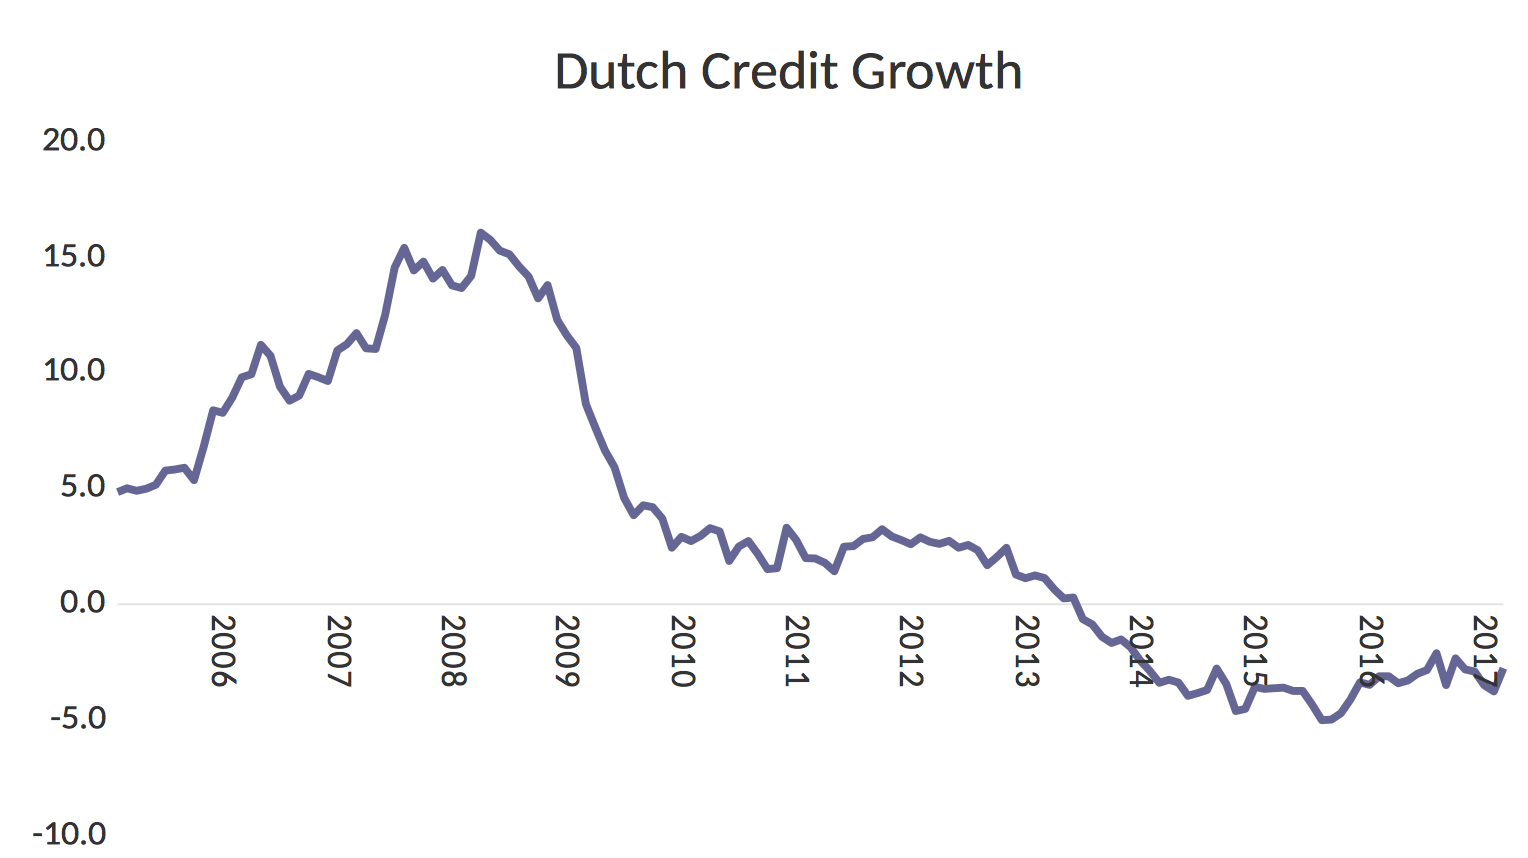
In a recent article in the Financieele Dagblad, Mathijs Bouman asks “If it is going so well with the Dutch economy why is lending not growing, yet?” (All quotes are my translations from the Dutch.) His evidence is the graph below (replicated from the same data used by Bouman, which is available at DNB’s website), which plots the growth rate of bank credit to Dutch firms over time.

Mr Bouwman says: “While in most European countries the credit flow is already growing healthily, it is still shrinking in the Netherlands.” In the graph above, the current growth rate is at about -3 per cent.
The problem with this statement is that the graph does not plot the correct variable. In the graph above is the growth rate of the stock of credit. That is, the growth rate of all the lending that has been done in the past that hasn’t been repaid yet. However, if firms need to borrow, the investment that they undertake will be financed by new borrowing and not by credit these firms took out years ago. In other words, investment depends on the flow of credit, and as a result, the growth rate of investment will be related to the growth of the flow of credit.
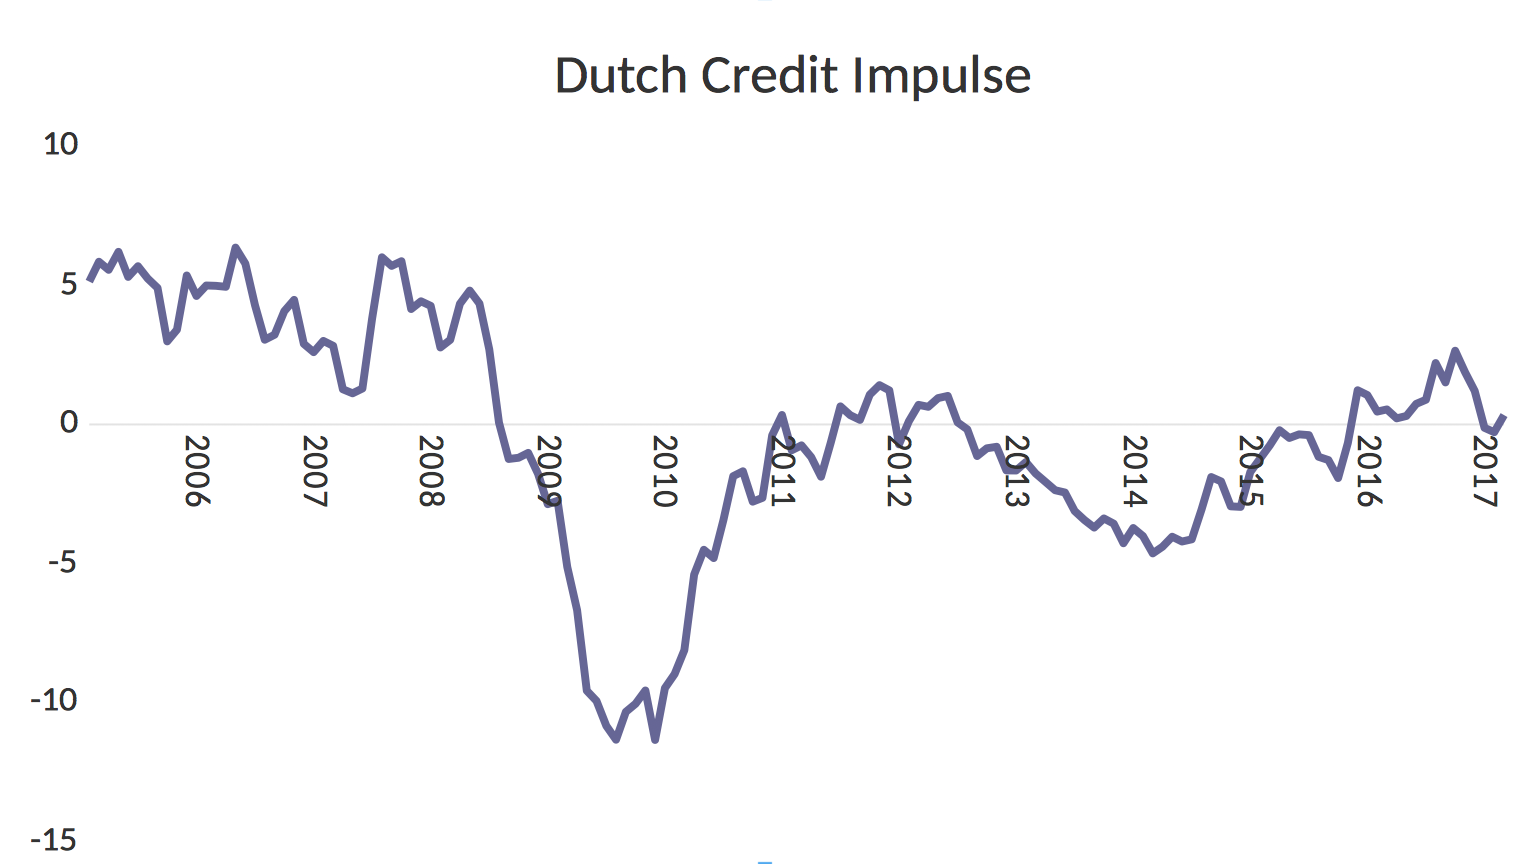
It turns out that the DNB spreadsheet is transparent in this. The first column is headlined Standen, that is, the stock of credit, and the growth rates in the DNB spreadsheet are calculated from this variable. Helpfully, however, the column next to Standen is Stromen, that is, flows. If one uses the flow of data to calculate the credit impulse, which is our prefered measure of the growth of credit, one obtains the graph below.

This graph reflects recent economic developments: In the years leading up to the financial crisis, the Netherlands was experiencing a credit driven boom. This is followed by the financial crisis, recovery around 2011-12, another milder downturn, and then the current recovery.
Unfortunately, using the growth of credit stock in place of the credit impulse appears to be a very common mistake. It underlies the idea of credit cycles, that I wrote about in a previous blog entry, and it is the source of the literature on Phoenix miracles that I addressed with Mike Biggs and Thomas Mayer in this paper. Milton Friedman asked in 1992 if old fallacies ever died. Maybe they do live forever.